Lubetech Oil Analysis Laboratory

Testing | Quality Commitment | Managing an Effective Program | Setting Up a Program |
Sampling Techniques| The Importance of Lubricants | The Purpose of Filters| Oil Analysis and the Environment | The Role of Additives | References | Contact Us |

Specialists

At Lubetech we analyse lubricants. This is our business. We provide a quality, reliable and rapid service for our clients.


Personal Service

At Lubetech, we offer a 'personal service' approach. We understand that any client, large or small, should be able to discuss their reports with the staff members associated with generating their reports. At Lubetech we understand that communication is absolutely critical for a successful partnership with our customers.


Quality Service

Lubetech is absolutely dedicated to providing a quality service for our clients. The quality management system of Lubetech Pty Ltd conforms to the requirements of AS/NZS.ISO.9001:2008


Independent

Lubetech is an independent used oil analysis laboratory. We do not have any allegiance with any oil manufacturer, filtration company, equipment or parts manufacturer.


Lubetech
Standard Testing

Lubetech Standard Testing Schedule

Click on the boxes below for information regarding all standard testing types undertaken by Lubetech. Click on the 'i' button to see further information regarding each form of analysis.To see the standard testing schedule for individual fluid types, please use the filters. All information should be regarded as general advice and guidance only. Not all tests are appropriate for all fluid types, please contact Lubetech to discuss any individual testing requirements and schedules.
ICP
Elementals and ICP
Press 'i' for details

Elementals and ICP


Metals at Lubetech are detected and analysed using an instrument called an 'Inductively Coupled Plasma Optical Emission Spectrophotometer' - ICP-OES. Argon gas is excited electrically and produces a plasma with a temperature of between 10,000 and 13,000 degrees centigrade into which a sample is sprayed. Elements have specific wavelengths and the data collected allows metal content to be given in parts per million.

Element Wear/Contamination Additive Sources General Elemental Information
Aluminium (Al) Pistons, Crank-shaft Bearings, Casings, Bushings, Shims, Washers, Bearing Cage Surfaces, Blowers, Impellers, Converters. Lightweight, strong material which aids in thermal transfer and dissipates heat well. It is the third most abundant element (besides oxygen and silicon) and the most abundant element in the Earth's crust. Aluminium is often present in association with silicon and is indicative of dirt/dust ingress. High aluminium in engines is generally sourced from pistons.
Barium (Ba) Barium as barium petroleum sulphonate is often used as a detergent additive as well as a corrosion inhibitor.
Calcium(ca) Calcium as calcium petroleum sulphonate is often used as a detergent additive. It cleans carbon deposits from engines and acts as a corrosion inhibitor and dispersant. When burnt, calcium additives have an content of (generally) >1% in engine oil formulations.
Chromium (Cr) Rings, Cams, Followers, Bearings, Cylinders, Rods, Valve Spools Chromium is a very hard, brittle, lustrous metal with a high melting point that resists tarnishing and takes a high polish. Its hardness often indicates that something harder than it is present - such as silica or alumina (sand). It can generally be found in new engines during run-in, hydraulic systems, final drives, differential bearings etc.
Copper(Cu) Bearings, Bushings, Thrust Washers, Friction Discs, Pump Bearings, Pump Wear Plates, Oil Coolers, Radiators, Clutch Plates, Sealing Compounds. Copper is a soft metal with very high electrical and thermal conductivity. It is used as a constituent of various metal alloys, as well as a conductor of electricity and heat. It is often present in hydraulic pumps, differentials, engines, final drives, compressors and cooler cores. High copper is often caused by oxidising (acidic) oil.
Iron (Fe) Liners, Gears, Blocks, Tappets, Rings, Bearings, Spacers, Valves, Cylinders, Pumps, Lines and Reservoirs, Oil Pumps, Rust. Iron, by mass, is the most common element on earth. It is used as the base metal of steel in many components due to its strength. Iron can be present as particles produced by wear or abrasions, but can also manifest as iron oxides associated with the presence of water or a corrosive reaction to additives.
Magnesium(Mg) Magnesium is the ninth most abundant element in the universe, and the third most commonly used structural metal following iron and aluminium. As Magnesium petroleum sulphonate it is used as an oxidation inhibitor (detergent additive) that leaves approximately <1% ash. It reacts with varnish and sludge to neutralise them and keep them soluble.
Manganese(Mn) Valves, Exhausts and Intake Systems, Blowers Manganese is a silver/grey metal that is hard, brittle, difficult to fuse, easy to oxidise. It can be sourced from valves, exhausts, intake systems, and blowers, but as Methylcyclopentadienyl manganese tricarbonyl (MMT or MCMT) it can be used as an additive to unleaded petrol, boosting octane ratings.
Molybdenum(Mo) Piston Rings, Surface Coatings. Molybdenum can be found as a wear element however it can also be used in oil formulations as an friction modifier additive (as molybdenum disulfide) and can be used as an additive in grease.
Lead(Pb) Bearings, Thrust Washers, Friction Discs, Pump Bearings. Lead is a very soft, malleable metal often used in alloys. Lead is often found in combination with tin in engine bearings and bushings, as well as in hydraulic pump alloys.
Phosporus(P) Phosphorus is used as an anti-wear, anti-oxidant additive, a friction modifier and as a protective film in high-pressure areas.
Silicon(Si) Silicon is the principal component of dirt, and when accompanied by aluminium is usually indicative of dirt/dust ingress. Silicon is can also be caused by repair/maintenance sealants and gaskets. It is very abrasive and can scratch hard surfaces easily. Silicon up to approximately 10-15ppm can reflect the presence of silicone based anti-foam additives.
Sodium(NA) Coolant, salts, washes, coolant and grease additives. Sodium is a soft, highly reactive metal and a member of the alkali metals. It is often found in coolant formulations as well as many salts, washes and seawater. In small amounts it can be found as a detergent additive. Sodium is most often indicative of coolant contamination.
Tin(Sn) Bearings, Thrust Washers, wrist and piston pins, rings, piston overlay seals, solders. Tin is a relatively malleable metal often used to plate and protect surfaces. It is used in soft alloys of bronze in combination with lead. It can be found in small amounts in hydraulic pumps, as well as in engines when associated with copper and lead indicating bearing wear.
Zinc(Zn) Zinc, here as ZDDP (Zinc Dialkyl Dithio Phosphate) is most often used as an additive, with anti-wear, anti-corrosive and anti-oxidant properties.

Particle Counter
Cleanliness & Particle Counts
Press 'i' for details

CLEANLINESS & PARTICLE COUNTS


Particle count testing measures the quantity and micron size of various solid and silt contaminants in an oil.

The preferred method of quoting the level of silt and solid contaminant particles in an oil sample is the use of International Standard Code ISO 4406. The code is constructed from the combination of two or three range numbers, ie 19/17/13 that indicates that there are between 2500 and 5000 particles of greater than 2 microns, 640 and 1300 particles larger than 5 microns, and between 40 and 80 particles larger than 15 microns. The numbers relate to a 1 ml sample of oil. More often 2 Range Numbers are used referring to >5 microns and >15 microns.

There are numerous methods for determining solid particle size distribution, such as by microscope counting, optical light blockage, laser light scattering, and mesh obscuration. Please click through the slideshow for more information on these particle count methods.

Lubetech employs the mesh obscuration and laser light scattering particle counters to ISO 4406:1999 standards.

PQ Index
PQ Index
Particle Quantification Index - Press 'i' for details

Particle Quantification Index


The PQ Index of an oil is a relative measurement of the ferrous (iron) metal content in a sample, regardless of particle size or shape

PQ analysers use quantitative unit-less numbers detected using which are primarily useful for trending and determining, in conjunction with elemental analysis, the overall size concentration of iron particles. Spectroscopic wear metal analysis can only detect the elements suspended in fluids up to a particle size of 10 microns or less. As the PQ analyser can detect particles far in excess of this size a better indication of the particle sizes and concentration can be determined.

Iron Detection & Potential Size Distribution

ICP Results PQ Index Results Size Distribution
Low High Overall Particle sizes are likely above 20 microns
High Low Overall particles sizes less than 10 microns
Even Even Overall distribution evenly spread

Wear Particle Size Distribution

Normal/Small Wear Particles

Small, mostly expected wear particles are due to typing welding/breaking cycle.

Significant Wear Particles

Medium sized particles, often visible in sample and results with a significant PQ Index, causing the gouging of metal and resulting in larger than normal particles generated. These can then in turn result in even larger wear particle generation.

Severe Wear

Large particles apparent in sample, often resulting from fatigue fractures of pitting of metal components. Severe wear, left unchecked, can induce enough wear to cause further disintegration and catastrophic failure.

TAN
TAN
Total Acid Number - Press 'i' for details

Source Effect Solutions
Extended oil drain intervals Corrosion of metal components Oil change
Incorrect oil type Oil degradation Monitor for overheating
High sulphur fuel Increases in viscosity Check fuel quality
Excessive blow-by Additives depletion Check oil type in use
Overheating Promotes oxidation Reduce oil change intervals

Total Acid Number (TAN)

TAN (total acid number) is the amount of acid and acid-acting constituents found in a lubricant.

This does not necessarily indicate metal corroding materials themselves, it can come from anti-wear additives, rust inhibitors or other additives. Increases in TAN of used lubricants from the starting point of the new lubricant (which will not be zero) usually indicates corrosive acid contamination or lubricant oxidation of the same used oil. In some instances the acid number can drop after the lubricant has been in use, indicating some initial additive depletion. Over time, the acid number will start to increase indicating the creation of acidic degradation products related to oxidation.

The TAN is a robust means of measuring monitoring a lubricant's service life and should correlate with increases in viscosity, oxidation and nitration numbers.

TBN
TBN
Total Base Number - press 'i' for details

Sources Effects Solutions
Overheating Oil degradation Decrease oil drain intervals
Extended oil drain intervals Increased acid number Confirm appropriate oil type for application
Incorrect oil type Increased wear Change oil
High sulphur fuel Acid build-up in oil Confirm TBN of new oils and use low sulphur diesel fuels

Total Base Number (TBN)

The Total Base Number (TBN) is the amount of alkaline material in a lubricant (usually corrosive reducers) and is called 'alkalinity reserve'; the level of alkalinity reserve available for neutralising acids.

TBN relates primarily to engine oils. The reasons for this being, additives in the oil are blended to neutralise sulphur acids formed in the crankcase through combustion. Measuring TBN indicates if the starting additive package still has the capability to counteract the sulphur/ combustion acids. TBN levels decrease as the alkaline properties are consumed. However, fresh oil additions can slow down this decline, thus influencing oil drain periods depending on engine operating conditions and maintenance.

As a rule of thumb minimum acceptable level of TBN is 3 for oils with a starting TBN of 10 or less. This does depend however on the type of oil and the starting TBN. Please consult your manufacturer for specific guidance.

VISCOSITY
Viscosity
Press 'i' for information

High Viscosity Sources and Effects

High Viscosity Sources Effects
Oxidation degradation Engine overheating
Extended oil drains Restricted lubricant flow
High running temperatures Increased operating costs
Incomplete combustion Destructive deposits and sludge
Leaking head gaskets Oil filter bypass

Low Viscosity Sources and Effects

Low Viscosity Sources Effects
Oxidation degradation Engine overheating
Extended oil drains Restricted lubricant flow
High running temperatures Increased operating costs
Incomplete combustion Destructive deposits and sludge
Leaking head gaskets Oil filter bypass

Potential Solutions

  • Check oil grade is appropriate for the application
  • Check operating temperature
  • Change oil and filter
  • Check air-to-fuel ratio
  • Check for loose fuel crossover lines
  • Check for leaking injectors

Viscosity

The viscosity of a lubricant is its flow rate at given temperature, usually 40°C and 100°C, reported in Centistokes (cSt) and normally analysed utilising a kinematic method. Generally speaking, for used oil analysis a fluid's viscosity is compared to that of the oil's condition when new to determine if excessive thinning (decrease in viscosity) or thickening (increase in viscosity0 has occurred. By itself viscosity is almost meaningless, except with new oil. It is better to take note of the contamination or external influences that are influencing the viscosity.

Decreases in Viscosity

Viscosity drops (low viscosity) are most often caused by incorrect oil additions, shearing of oil and liquid fuel contamination. The addition of an incorrect oil is often a case of a lower viscosity oil being added to systems running and requiring a higher viscosity lubricant. Liquid fuel contamination is often referred to as fuel dilution and is isn't uncommon in marine, motorcycle, and general and racing automotive engines.

Increases in Viscosity

Viscosity increases (high viscosity) are caused by incorrect oil additions, solids contamination and oxidation/degradation of the oil. Often a significant increase in viscosity, for example from one grade to the next, is a warning or indication that an oil has reached the end of its useful life. It is possible to have a normal viscosity figure when an increase in oxidation is counterbalanced by fuel dilution. In this case a low flash point (high fuel contamination) and a high solids figure would be indicated.

As a general guideline 15% to 20% decrease or increase is acceptable for most applications. However sudden large changes in viscosity, particularly in a downward direction should be regarded as danger signals.

Viscosity Index

The Viscosity Index (VI) measures how much viscosity changes with temperature. It is an independent, standalone measurement of a lubricant's performance under different temperature ranges. It has been developed as an arbitrary measure whereby the lower the VI, the greater the change in viscosity with temperature and vice versa. Higher quality base oils and viscosity improving additives are widely used to improve VIs to beyond 100. Synthetic oils have a VI of between 80-400.

Fuel Dilution
Fuel Dilution
Press 'i' for information

Sources Effects Solutions
Extended idling Poor lubrication Examine fuel lines
Defective injectors Metal to Metal contact Check timing
Incorrect air/fuel ratio Cylinder ring wear Avoid prolonged idling
Stop and go driving REduce fuel mileage change oil and filter/s
Incomplete combustion Depleted additives Check fuel quality
Incorrect timing Reduce engine performance and life CHeck driving and operating conditions

Fuel Dilution

Fuel dilution is the term used to describe testing for the levels of unburnt fuel found in sumps/crankcases of liquid fuelled reciprocating engines. (Hence, engine oil diluted by fuel) All liquid fuelled reciprocating engines will have a certain amount of fuel through blow-by. It is an excessive quantity of liquid fuel that indicates problems such as leaking injectors, injector seals, pumps, worn rings, faulty carburettor floats and high soot/carbon levels.

Excessive fuel dilution effects the viscosity and film strength of the oil, which can cause abnormal wear, particularly in the cylinder/ring region. In extreme cases even crankcase explosion is possible. Significant fuel dilution leads to damaging drops in viscosity and metallic additives such as phosphorus, zinc, calcium and boron become diluted reducing the film strength and increasing wear.

Typical dilution figures are maximum of 2% in diesel engines and maximum of 4% in petrol engines.

Soot
Soot / Percentage Solids
Press 'i' for information

Soot and Solids Sources, Effects and Solutions

Sources Effects Solutions
Fuel soot Sludge formation Oil and filter change
Oxidation by-products Filter plugging System flush
Extended oil drain intervals Decreased oil flow Investigate and change operating system
Environmental debris Shorter engine life Reduce oil change intervals
Leaking or dirty filters Increased wear
Poor lubrication
Engine deposits

Soot / Percentage Solids

This is the measurement of all solid or solid-like debris in a lubricating system. In engines this is referred to as “soot”.

Diesel engines have greater solids primarily due to fuel, and soot is normally a by-product of incomplete combustion and in normal operation is blown past valve guides and piston rings. In diesel engines, excessive solids are caused by inoperative filters, worn rings, valve guides or turbo charger seals, poor quality fuel, oxidation of oil, faulty injector spray, over-fuelling and dirty/restricted air intakes. For non-diesel engines, the oil's oxidation and wear debris products are usually what's measured.

If the soot content is too high, the viscosity can become affected as the soot thickens the oil. Elevated soot levels can also cause an oil's TBN (Total Base Number) to drop more quickly than normal as the soot increases the formation of the acids which must be neutralised to prevent wear from occurring. Dispersant additives are utilised in engine oils to suspend the soot particles to prevent from agglomerating (sticking together) and attaching to pistons, rings and liners. Once soot content becomes too high, additives can no longer keep the soot suspended resulting in deposits forming on the rings, weakening the seal between the pistons and cylinder liners.

Generally speaking, in diesel engines 4% solids will require corrective action and change of oil. In petrol engines the maximum is 5% solids. These percentages can differ depending on the application and engine system type.

In other systems much lower levels of tolerance are accepted, as there are no combustion solids. Steam and gas turbines can fall into this category. Expected levels are usually 1% or less.

IMAGE
Water
Press 'i' for information

Water Contamination (% Volume of Water)

When sampled correctly, water is not generally found in systems at levels above 0.05%, and in larger amounts water can be very damaging to a system.

Water can present in lubricants as either dissolved, emulsified or free (suspended) water. The state whereby an oil can no longer hold any further dissolved water is referred to as the saturation level. Oversaturated lubricants typically appear cloudy, and the saturation level of an oil depends strongly on the type of base stock used, additive package, operating conditions - pressure and temperature levels

Oil based lubricants contaminated by water can damage the metal surfaces the lubricants are designed to protect. The effect of friction within a lubrication system can cause operational temperatures in excess of the boiling point of water, resulting in what can be loosely described as 'steam cleaning' an oil away from surfaces in systems where there is excessive moisture content. Excessive water content can also promote the oxidation of the oil leading to corrosion and poor lubrication.

Moisture is often sourced from coolant leaks, engine blow-by gasses and the condensation from a system cooling down.

Sources

Environmental

  • Access panels
  • Breathers
  • Worn seals
  • Rain leaking to external reservoirs
  • Seepage via reservoir covers
  • Condensation

Process

  • Coolant leakage
  • Heat exchanger leakage
  • Sprays
  • Washes
  • Steam

Effects

  • Surface corrosion
  • Metal surface fatigue
  • Component wear
  • Reduced lubricant viscosity
  • Reduced lubricant load carrying ability
  • Increased oxidation
  • Increased deposition characteristics
  • Premature additive depletion

Water Removal Methods

Drainage

Free water that has sunk to the bottom of a tank or reservoir is drained from the system. Appropriate for: free water.

Centrifuges

designed to separate water from oil via centrifugation. Appropriate for: free water.

Coalescers

separate emulsions into their constituent components, mechanical coalescers use filters or baffles, electrostatic coalescers use DC or AC electric fields or combinations thereof. Coalescers use specialised cartridges to combine smaller, dispersed water droplets into larger ones, hence the term coalescer. Appropriate for: free water.

Absorbent Filters

moisture in the form of lightly emulsified or free water is removed by super absorbent polymers in a filter. Appropriate for: Emulsified and free water.

Vacuum Dehydration

removes moisture via heat and vacuum, where water is removed as vapor.Appropriate for: dissolved, emulsified and free water.

FTIR
Oxidation and Nitration
Press 'i' for information

Sources Effects Solutions
Defective seal Increase in viscosity Correct/increase operating temperatures
Low operating temperatures Nitrous oxide ingress Correct air/fuel mixture
Blow-by Accelerated oxidation Check crancase ventilation, hoses and valves
INcorrect air/fuel ratio Increased TAN
Incorrect scavenge Increase in cylinder wear
Acidic by-products

Oxidation and Nitration

Oxidation

The oxidation of an oil occurs when it is either exposed to air or as a by-product of combustion in engine oils. The oxidation process produces acids resulting in viscosity increases and corrosive wear. Additives that prevent oxidation, referred to as oxidation inhibitors, or anti-oxidants are normally incorporated into most formulations and are used to counteract the effects of heat and oxygen which lead to oxidation.

Nitration

Nitration results from a reaction of an oil with gaseous nitrous oxide created during combustion and normally results from an unbalanced air to fuel ratio in an engine. This refers to an engine running too 'lean', where there is too much air and not enough fuel nitration occurs. Nitration often indicates that an oil is becoming increasingly saturated with soluble and /or insoluble nitrogen-oxide compounds. Two forms of nitrogen can result from the reaction of nitrogen with base oils: nitro compounds cause by the blow-by process and organic nitrates, the results of a reaction in the cylinder walls.

Density
Fuel Density
Press 'i' for more information

Density

Diesel fuels have a general density of approximately 0.832 kg/L, whereas petrol (or ‘gasoline’) ranges from between 0.71-0.77 kg/L and is sold on the market to a standard reference of 0.755kg/L with price fluctuations increasing or decreasing depending on the actual density of the fuel.

Densiity can be used to aid in fuel quality trending, as a tool in diagnosing mixed fuel types and for tracking and trending bunker fuels.

pH Values
pH Values
Press 'i' for more information

pH Values

Engines use coolants to remove heat energy and coolants are critical to ensuring that engines are operating properly and efficiently. Engines overheating can result in accelerated deterioration of the engine oil as well as failure of the engine itself. Most engines use coolants with an approximate mix of 50/50 water and ethylene glycol. The water provides the heat transfer element of the mix and the glycol provides freeze protection. In addition, many coolants contain additives such as anti-foams, corrosion inhibitors, dyes etc. Coolants degrade over time with the glycol breaking down into formic and glycolic acids. Coolants should be regularly tested and as a general rule, the pH value should not drop below 7.0, with only a few coolants designed to run as low as 6.5. For the most part, and there are exceptions, conventional coolants should have a pH level of between 8.5 and 11.0, and long life coolants between 7.0 and 9.0.

Low coolant pH can result in significant corrosion and high pH levels can lead to aluminium and copper corrosion.

These figures should be seen as a guide only and original manufacturer’s guidelines should be followed.

IMAGE
Conductivity
Press 'i' for more information

Conductivity

Conductivity testing measures a coolant’s ability to resist carrying an electrical current between two dissimilar metals. It is the reciprocal of electircal resistivity (ohms) and it is used to measure the concentration of dissolved solids which have been ionized in a solution, such as coolant.

High conductivity levels can often be down to high metal corrosion, improper water or the over-use of supplemental coolant additives. Where conductivity levels are too high, the effectiveness of inhibitors are reduced and damaging corrosion and pitting can occur.

As a general rule, levels greater than 6600 should be considered notable, greater than 7500 should be an alarm and levels greater than 8000 severe.

IMAGE
Glycol
Press 'i' for more information

Glycol

Glycol is used to suppress the freeze point of a coolant and elevate the boiling point. The starting percentage in a coolant will vary from manufacturer to manufacturer, however as a general rule coolants have a 50/50 glycol water mix. Where operating temperatures are consistently below -35 degrees centigrade a 60/40 glycol water mix is normally recommended. If the glycol concentration is high, e.g. above 70% the freeze point is not significantly improved and heat transfer capacity is reduced, leading to additive insolubility.

Specialist Testing
Specialist Testing
Press 'i' for more information

Specialist Testing

Please contact Lubetech to enquire about any requests you may have about specialist testing and schedules.


9001 picture

Our Commitment to Quality

It is the objective of Lubetech Pty Ltd to supply quality products and excellent services to our customers.

The quality management system of Lubetech Pty Ltd conforms to the Requirements of AS/NZS.ISO.9001:2008

We will endeavour to maintain a reputation for service through training of staff, modernisation of methods and equipment and continual improvement of quality through this effective Quality Assurance System.


1. Reporting

From 2015, Lubetech shall endeavour to return 95% of oil analysis reports (where appropriate*) to their clients within 24-48 hours of receipt of the sample. Lubetech is targeting an improvement of 1% per year to 2017.

All reporting statistics shall be accumulated and analysed on a yearly basis using the current and in-development software and reviewed at the annual Management Business Review in December 2015, 2016 and 2017.

*Exclusions - Reporting turnaround, where a sample provided by a client does not include enough information to proceed with reporting and clients are contacted for further details, shall be excluded from the statistics as these instances are outside of Lubetech’s control. Example: Oil sample returned with no identifying unit information.


2. Reporting Integrity

Lubetech aims to deliver the highest quality analysis and reporting possible. To this end, Lubetech shall endeavour to proof 100% of all reports. In addition, Lubetech aims to have the names of both the report author and proofer stated on each report to ensure clients are confident their reports have been analysed to the highest quality.

The proofing requirement is currently built in to the gSMART software and shall be built in to the software currently being developed. All reporting statistics shall be accumulated and analysed on a yearly basis using the current and in-development software and reviewed at the annual Management Business Review in December 2015, 2016 and 2017.


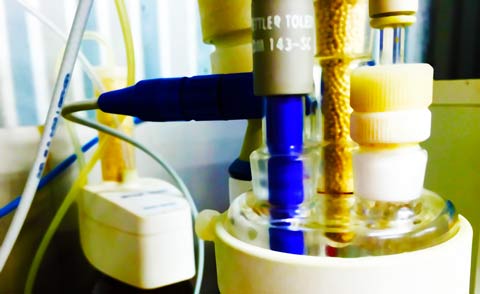
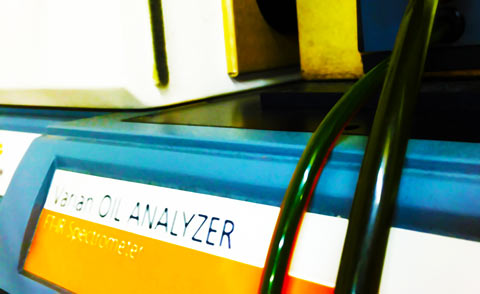
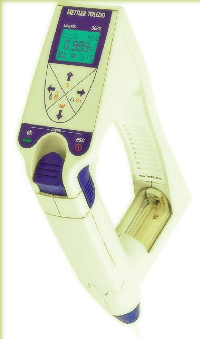
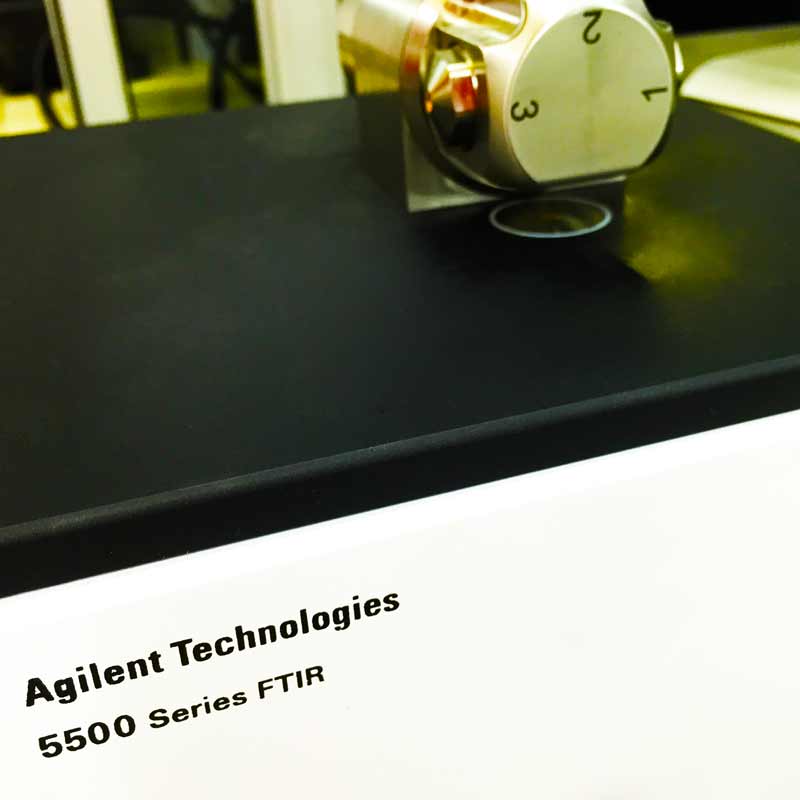
3. Highest Quality Instrumentation & Calibration

Lubetech shall only use the highest quality instrumentation, and shall calibrate as required by each Standard used in the laboratory.

Lubetech shall record both electronically and in hard copy all calibration records and shall collate, analyse, review and report on all calibration and Standards records at the annual Business Review in December 2015, 2016 and 2017.


4. Dispatch of Sampling Kits

Upon receipt of a purchase order 95% of kits shall be dispatched within 24 hours on a year on year basis.

All dispatch statistics shall be accumulated and analysed on a yearly basis using the data gathered from MYOB and the dispatch log, then reviewed at the annual Management Business Review in December 2015, 2016 and 2017.


Managing an Effective Program


What's it really about?

At its heart, testing and analysing lubrication oils is about keeping a close eye on the condition of your equipment. Oil analysis provides the opportunity and significant advantage of receiving early warning signals from your equipment that would be otherwise very difficult to detect. By catching out problems early, the issues can be arrested and resolved before any permanent or catastrophic damage can occur. It is a relatively small insurance premium for the life and extended optimum serviceability of your machinery.

Return on investment

One of the most significant costs to any organisation is loss of production that results from equipment down time. By utilising an efficient and effective oil analysis programme equipment life can be maximised and extended, with the programme identifying small issues and problems and fixing these before they get worse - reducing the need for unexpected outlay and the capital costs of new equipment.

How does it work?

An effective oil analysis programme works by tracking the regular sampling of a machine's oil. By monitoring the data over time, any abnormal spikes or upward trending of individual or combined result can indicate the impending failure of a component or part. This is a highly effective way of diagnosing an issue, as often a machine's tolerance level can be very different across manufacturers and models, thus the individual trending results can provide the best picture of that individual unit's running health and maintenance requirements. Monitoring your equipment's health can allow for warning signals to be identified prior to damage occurring.


image text

Setting up your program


1. Ensure your program goals are realistic and achievable

Determine what your key goals are for the programme - what are the company's current maintenance practices and approaches, and how can this be best improved? Do you hope to:

  • Reduce labour costs?
  • Reduce repair costs?
  • Reduce unscheduled and unexpected machinery downtime?
  • Track equipment and maintenance costs?
  • Increase/Enhance oil change intervals?
  • Move to a proactive rather than interval based maintenance schedule?
  • Extend equipment life?
  • Increase and enhance machine reliability?

2. Determine the resourcing, training and management components of your programme

  • What resources are currently in place for performing any recommended maintenance requirements?
  • Who will be in charge of the programme internally?
  • Where will reports go, who will ensure they are understood and acted upon, will appropriate management level support and development be required?
  • What training may be required?
  • Will the data gained from oil analysis be used for future purchasing decisions?

3. Determine the scope of your programme

  • How many machines, components or units will be sampled and at what intervals?
  • Determine the sites, site managers and technical staffing that will undertake the oil sampling across various sites.

4. Develop your equipment list

It is vitally important to ensure your equipment list is as comprehensive as possible. The more information you provide to your laboratory the better their recommendations and condition monitoring can be. Ideally the following list should be provided to the laboratory:

  • Component or unit type
  • Manuacturer
  • Model
  • Compartment type
  • Oil manufacturer
  • Oil type/name
  • Viscosity grade (ISO or SAE)
  • Filter type where applicable
  • Sump capacity
  • OEM recommended oil change intervals

5. Sampling intervals

For most machinery a manufacturer will recommend oil change intervals and general maintenance requirements, and these are the most appropriate recommendations for developing preventive maintenance schedules, however the following should also be considered:

  • Your company's experience with the machinery - repair times, general reliability, previous maintenance, replacement and downtime costs.
  • The level of importance - how critical the machinery is for production.
  • Environmental pressures - excessive idling times, hot/cold/dirty operating conditions, compromised air intakes, etc.

6. Turn-around time

Another key aspect of an effective oil analysis programme is ensuring results of your sampling are available to you as soon as possible. All Lubetech's oil analysis reports are provided within 24-48 hours of receipt (where the unit has been correctly identified/identifying unit information has been provided with the sample) but it is equally as important that the samples taken on site are managed and despatched so their results are as timely and appropriate as possible.

  • Despatch samples, where possible, the same day they are taken.
  • Ensure all paperwork is filled out with as much information as possible for each sample.

7. Managing your results

Upon receipt of your results from the laboratory, it's best to consider what management need to know the most. The size and composition of your organisation will dictate how results are managed and the way in which the maintenance schedule is maintained, however there are key areas that should be shared with top management:

  • Reports indicating imminent failure or drastic changes in machinery trends
  • Scheduled equipment downtime
  • Rates of catastrophic failure reductions achieved through oil analysis
  • Rates of cost savings due to reduced oil change intervals and improved machinery reliability


Sampling Techniques

Lubetech's Advice and Guidance

Sampling technique, in the context of oil analysis, is as important as the laboratory testing itself. The quality of the report can only be as high as the quality of sample taken from a unit. It is extremely important to take a sample that best represents the total oil volume - ideally taken when the machine is running, and from a point that has not been compromised by any build up (drain point samples etc).

Sampling guidance by type


General advice
image text
General sampling advice
General advice for sampling appropriate for most applications

General sampling advice

Always sample consistently - trending is best analysed and forecast when samples have been taken in a consistent, repeatable manner.

Sample when the machine is still hot/running, this ensures a sample which best represents the volume as a whole.

Sample via optimal sampling points - choose a location, preferably in areas of turbulence and movement (such as bends) to ensure sample is representative.

Sample before the oil or filters have been changed, or before smaller volumes of oil are added to the system.

Always provide as much information to the laboratory via the label as possible. Accurate trending depends on data quality. The more information is provided, the more accurate diagnosis and trending can be.

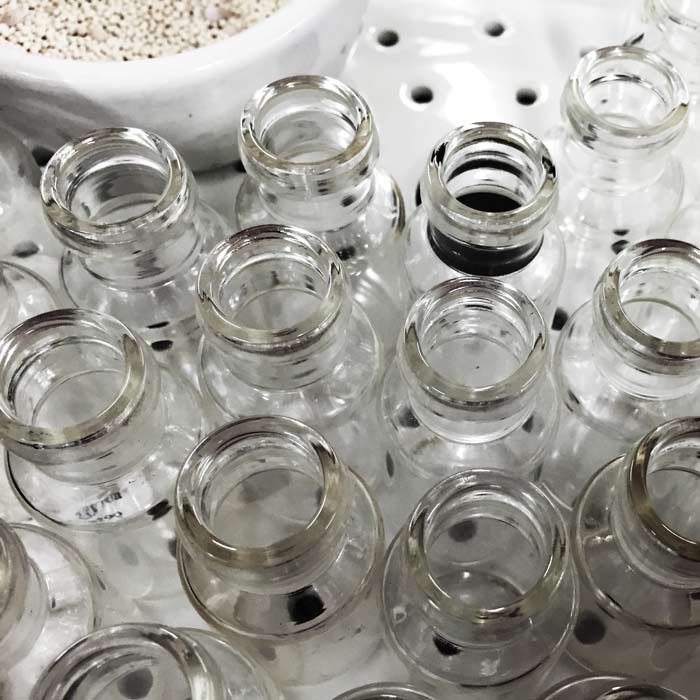
Always sample in as clean a manner as possible - clean containers, equipment, pumps, tubing and paperwork.

Always tightly seal the sample bottles and clean the exterior before they are despatched to the laboratory.

Develop and maintain standard procedures and work instructions for sampling, ensuring all officers and technicians are aware of the correct methods

Circulating Systems
image text
Circulating Systems
Advice for in-line and reservoir sampling points for circulating systems

Circulating Systems


Circulating Systmes - General Advice


Always use in-line sampling points where possible

In-line samples are taken from the return line after oil has passed through the equipment, and before the entry on the return side of a reservoir.

Never sample after a filter, as this voids much of the valuable data.

Never use rags, towelling or any material that deposits lint or particles, particularly with sampling that requires a particle count.

When using a sampling pump and tubing always thoroughly clean the area around the sampling valve, and flush the access point.


In-Line circulating sample points

  • Hydraulics: Manifold or return lines
  • Engines: Filter mounts on engine blocks, before filter inlets
  • Axles: From oil pumps
  • Transmissions: Via the filter head, before the filter inlets
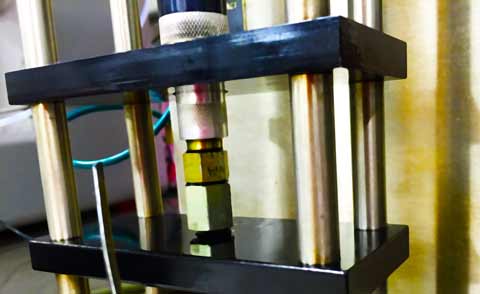
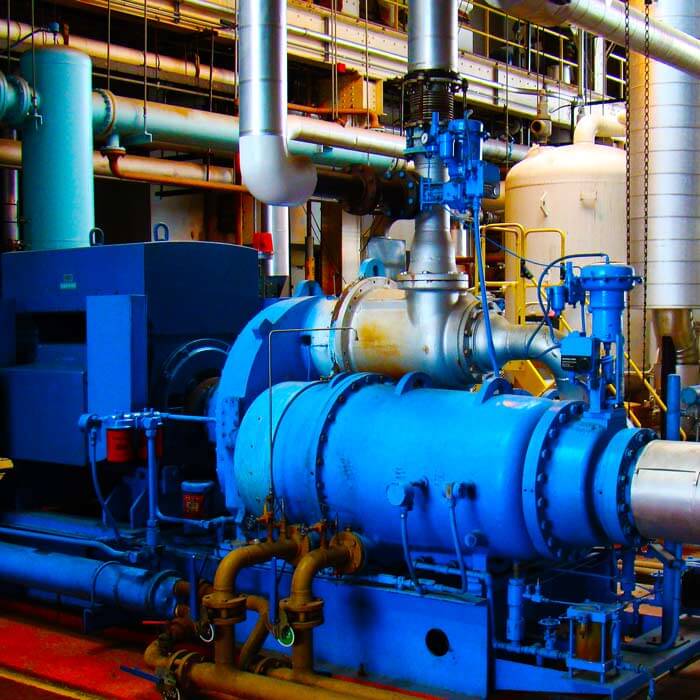
  • Compressors: Via the main return line, before reservoir where possible
Drain Point Samples
image text
Drain Point Samples
General advice for obtaining a sample via the drain point.

Drain Point Sampling Advice


Drain point sampling should be avoided where possible as contamination is likely with this sampling method. This cannot always be avoided however, and as such the following is advised:


Ensure drain point has been thoroughly cleaned of debris before sampling.
Always flush the drain point thoroughly before taking the sample.
If sampling during an oil change, ensure the sample is taken midway through the drain to ensure a representative sample is taken.
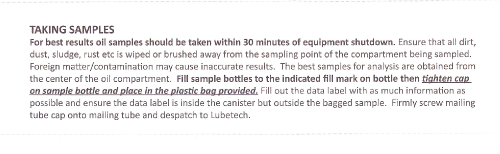
image text
Lubetech Data Label
data label example
Lubetech Label

Example of a Lubetech Data Label with Sampling Instructions on the back. \


The importance of lubricants


Friction

To describe it simply, friction is the accumulation of force that prevents motion between two surfaces that move against, or move relative to each other. The amount of friction that occurs is directly related to the load placed on each of the two surfaces. The smaller the surface area where contact occurs, the greater the effect of the load per square millimetre. Where there are rougher surfaces this effect is increased further, and even the smoothest of surfaces will contain microscopic peaks and troughs. No matter how smooth a surface appears to the naked eye, all surfaces contain irregularities to some degree. Often these irregularities can only be seen under a microscope. Ultimately friction depending on its severity can lead to heat and wear. The peaks on the surface (named asperities) when in contact can break off and lead to further abrasion, again accelerating the wear process.

Lubricants provide protective films that work to separate two rubbing surfaces and reduce the amount of friction between the them.


Friction reducing materials

  • Liquids
  • Semi-solids
  • Solids

Liquids as lubricants

Liquids are mostly used where they can be easily contained and protected from contamination, and include oils (synthetic, vegetable or petroleum-based) or fluids such as solvents or water combined with additives.

Liquids as lubricants can be imagined as microscopic slippery balls, that move and slide over each other. The size of the 'balls' can be imagined as representative of the thickness of the lubricant (viscosity). Lubrication works by forcing the 'balls' between the two surfaces moving against one another, with the effects of the asperities reduced depending on the viscosity of the lubricant (the size/thickness of the 'balls'). If a lubricant is too thin, the 'balls' cannot keep the surfaces sufficiently apart to allow unimpaired motion. If one surface is harder than the other, the softer material will be worn or gouged away by the asperities of the harder materials which will then be picked up by the lubricant and circulated through the system.


Filters


The purpose of filters

To extend the service life of lubricants if is necessary to remove contaminants. Oil filters are designed to remove contaminants and there is a wide range of filters on the market. Most filters employ cellulose, paper or cotton elements as the filtering medium. Filters will reduce the solid matter contamination to the relevant micron size without detriment to the properties of the lubricant, meaning that additives such as anti-wear, anti-foaming etc. cannot be removed from the oil formulations. Even polymers utilised as viscosity index improvers and 'tackifiers' will pass through the filtration unit as these additives are dissolved into the oil base.

The life of filters should be monitored alongside that of lubricants for effective maintenance schedules.


Oil Analysis and the Environment


Lubetech takes its environmental responsibilities very seriously and endeavour to do as much as possible to reduce waste, protect the earth's vital resources and operate as sustainably as possible.


Lubetech assists our clients wherever possible to conserve natural resources and reduce as much waste as possible as part of our core business. Oil analysis provides customers with key information regarding the remaining life of the lubricants they use and and consequently, extended drain intervals. By extending oil change intervals, the materials, energy and chamical pollutants required to manufacturer new fluids are reduced. Additionally, condition monitoring allows clients to significantly extend the life of their machinery and equipment. By reducing wear, breakdowns and failures machinery life can be extended and the need for replacement units reduced.

Extended oil change intervals

  • Reduced reliance and use of oil
  • Less oil wasted


Inside the laboratory Lubetech is equally as committed to reducing waste and operating as environmentally friendly as possible. Within the laboratory all efforts to reduce, reuse and recycle are undertaken, where possible and appropriate to do so.

  • PET (polyethylene terephthalate) sample bottles are recycled
  • Mailing canisters are re-used where appropriate and recycled after they are no longer fit for purpose
  • Used oil that has finished the testing process is disposed of via Transpacific Waste Management
  • Roof top solar arrays on premises
  • Glass (rather than plastic disposable) test tubes are washed and reused.
  • All reagents and solvents are disposed of environmentally.


Maintenance Approaches


Different styles of maintenance lead to different levels of cost

The type of maintenance approach a company takes depends greatly on the depth of vision, resources available and the company's strategic capabilities. To get the most from your equipment, Lubetech recommends a proactive maintenance schedule to keep maintenance costs to a minimum with no unexpected equipment downtime and no loss of production.

Studies have consistently found that regardless of the industry type, reactive maintenance is the most costly maintenance approach. In the 2006 'Plant Maintenance Cost Justification' study undertaken by the Electric Power Research Institute (EPRI) in the U.S, showed the following results:

  1. Reactive: $17.00
  2. Preventive: $13.00 (= 24% reduction from reactive maintenance)
  3. Predictive: $9 (= 47% reduction from reactive maintenance)

  • Gears Reactive Maintenance

    Reactive Maintenance

    Repairs and maintenance undertaken when faults and failures occur.
    GENERAL EXAMPLE You get a flat tyre, you replace your tyre or fix the leak. Maintenance based on your REACTION to the issue.

  • Gears Preventive Maintenance

    Preventive Maintenance

    Predetermined schedule, often based on manufacturer's recommendations
    GENERAL EXAMPLE You replace your tyres bi-annually, or every 50,000km. Maintenance based on SCHEDULES

  • Gears Predictive Maintenance

    Predictive Maintenance

    Shedule based on actual conditions of machinery and equipment
    GENERAL EXAMPLE You replace your tyres based on a mechanic's measurement of tread depth. Maintenance based on MEASUREMENT.

  • Gears Proactive Maintenance

    Proactive Maintenance

    Schedule based on the condition of machinery and equipment, alongside known trends and the condition of individual units. Maintenance based on trending and maintenanc eof known issues, minor failures and root causes
    GENERAL EXAMPLE You check tyre pressure regularly, alongside tread depth for signs of wear, degradation and failure, because you have learnt from past tyre problems that this attention will prolong the life of the tyres

Key Facts
  • Studies have repeatedly found that regardless of industry application, reactive maintenance is the least efficient and cost effective approach.
  • Trend analysis and condition monitoring is the key component of predictive maintenance

The Role of Additives


Oil additives are chemical compounds that improve the lubricant performance of oils and can counteract the ill-effects that are caused by contaminants. Different additives are utilised in different applications, and manufacturers will tailor their products accordingly.


Additives for Chemical Breakdown


Detergent Additives

Clean and neutralise oil deposits inside engines in conjunction with DISPERSANT additives (see also: Contaminant Control) which separate what has been cleaned to mitigate 'sludging', particularly when moisture is present.

Corrosion and Rust Additives

Retard the oxidation of metal inside an engine by countering acidic effects on metals. In engine oils reserve alkalinity is included in the formulation of the oil to neutralise acids formed by combustion. This is reflected by the Total Base Number (TBN) of an oil.

Anti-Oxidant Additives

Retard the degradation of base oil by oxidation, and are widely used to provide chemical protection to oil wetted surfaces. They protect the base oil whilst allowing the lubricant to continue its major function of carrying the relevant additives to the areas they are required, maintaining the fluid film gap between surfaces

Metal Deactivators

Stabilise fluids by deactivating metal ions, they create a film on metal surfaces to prevent the metal causing the oil to be oxidised. Metal deactivators inhibit the catalytic effect of these ions (particularly copper) and retard the formation of gummy and gel-like residues.


Additives for Viscosity


Pour Point Depressants

In some applications cold temperatures can be experienced that can potentially freeze lubricants, pour point depressant additives enable the oil to pour at low temperatures

Viscosity Modifiers

Oil tends to become thin at high temperatures; viscosity modifiers make an oil's viscosity higher at elevated temperatures improving its viscosity index.


Additives for Lubricity


Anti-Wear Additives

Wear inhibiting additives chemically treat metal surfaces making them 'slippery'. They cause a film to surround metal parts, helping to keep them separate.

Friction Modifiers

Alter the lubricity of the base oil, they are used for increasing fuel economy by reducing the friction between moving parts.

Extreme Pressure Agents

These additives bond to metal surfaces and prevent them from touching even at high temperatures.


Additives for Contaminant Control


Dispersants

Dispersants keep contaminants in oils suspended to prevent them from coagulating and 'sludging'.

Anti-Foaming Additives

Prevent the production of foam and bubbling which can cause a lack of lubricant to critical locations and pitting and corrosion from where entrained air and combustion gases contact metal surfaces.

Anti-Misting Additives

These additives bond to metal surfaces and prevent them from touching even at high temperatures.

molecules

Contact Us


Unit 2, 20 Meadow Avenue
Coopers Plains QLD 4108
AUSTRALIA

Tel: 07 3274 5297
Fax: 07 3274 5232
Email: lab at lubetech dot com dot au